
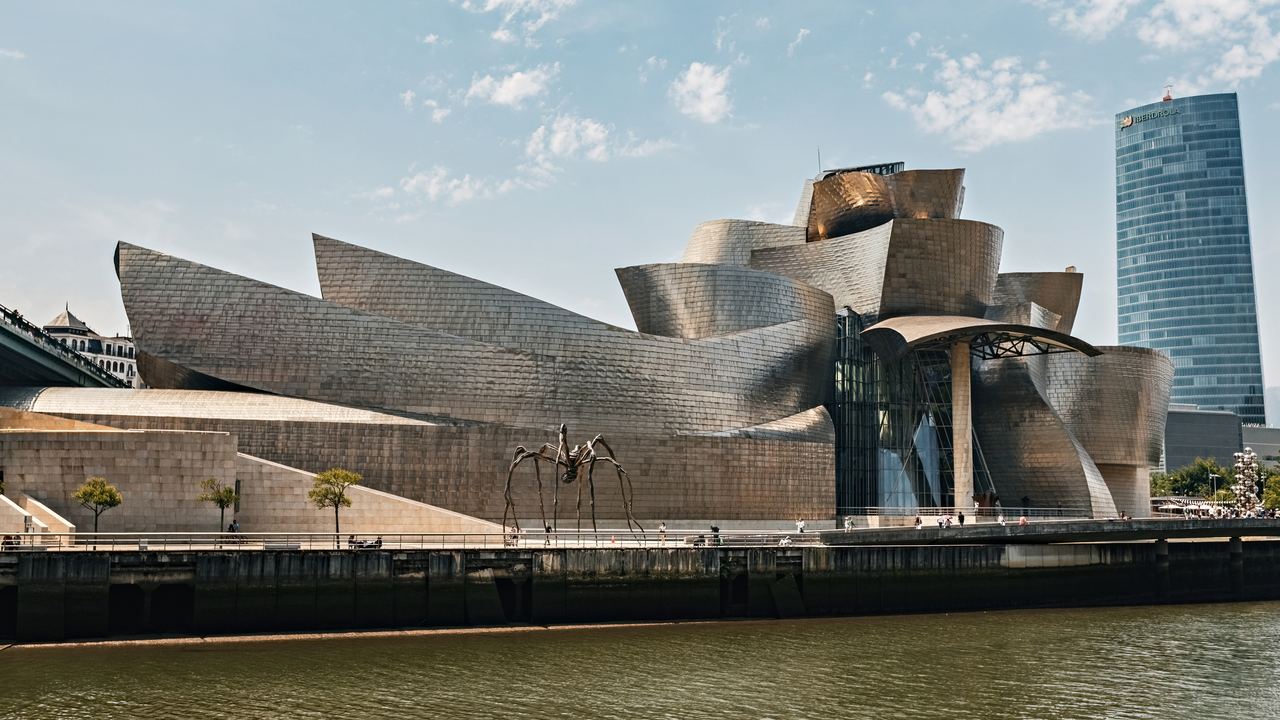
The best time to visit the Guggenheim museums depends on the city, because the buildings are indoors and the weather around them is what changes. For New York choose April, May, September or October. For Bilbao and San Sebastián choose May, June or September. For Venice choose April, May or September, and treat November as the month when the lagoon is most likely to flood. Abu Dhabi, scheduled to open on 11 December 2026, is a November to March destination. This page gives the 1991-2020 climate normals behind those calls, so you can overrule us.
The museum is open in every month. What you are choosing is how the walk to it feels: a quarter-mile ramp in January wind, a rainy November in the Basque Country, a lagoon at high tide. Pick the city first, then the month.
Which months suit each Guggenheim city?
Month-by-month verdict, by city
Numbers 1 to 12 are January to December. "Best months" means the most comfortable weather for a visit. It does not mean the quietest, and it does not mean the museum is shut in the other months.
| Month | 1 | 2 | 3 | 4 | 5 | 6 | 7 | 8 | 9 | 10 | 11 | 12 |
|---|---|---|---|---|---|---|---|---|---|---|---|---|
| New York Highs of 62 to 76 °F in those four months and almost no snow. January and February average 40 and 42 °F with lows below freezing and 3 to 4 snow days each. | 1 | 2 | 3 | 4 | 5 | 6 | 7 | 8 | 9 | 10 | 11 | 12 |
| Bilbao Rain falls 7 to 10 days in May, June and September, against 13 or 14 in November and January. November is the wettest month at 171 mm. | 1 | 2 | 3 | 4 | 5 | 6 | 7 | 8 | 9 | 10 | 11 | 12 |
| San Sebastián The city gets about 1,680 mm of rain a year at the coast. July is the driest month and still has 90 mm, so no month is dry. | 1 | 2 | 3 | 4 | 5 | 6 | 7 | 8 | 9 | 10 | 11 | 12 |
| Venice Mild highs of 63 to 75 °F. Of 296 recorded high-water events from 1872 to 2018, only 7 fell in April, 4 in May and 2 in September. | 1 | 2 | 3 | 4 | 5 | 6 | 7 | 8 | 9 | 10 | 11 | 12 |
| Abu Dhabi (opens 11 December 2026) Highs of 76 to 88 °F from November to March. From May to September they run from 103 to 110 °F. | 1 | 2 | 3 | 4 | 5 | 6 | 7 | 8 | 9 | 10 | 11 | 12 |
Editorial judgment on 1991-2020 normals. No monthly crowd series is public for New York or Venice, so those rows rest on weather alone.
How we ranked the months
We used three inputs and kept them separate. First, temperature: a high between roughly 60 and 77 °F (16 to 25 °C) is comfortable for walking between a station and a front door. Second, rain: both the millimeters and the number of wet days, because ten drizzly days feel different from four downpours. Third, where a public series exists, how full the city is. That last input exists only for Bilbao and San Sebastián. For the other cities we say so rather than guess.
The ranking measures the trip, not the museum. A gallery stays dry in every month. If you are flying in for a single building and plan to be inside most of the day, move every "Good" month up a notch and decide on price and crowds instead. Our guide to which Guggenheim to visit covers that choice.
New York: when is the best time for the Guggenheim on Fifth Avenue?
April, May, September and October. Average highs climb from 62 °F in April to 71 °F in May, fall back to 76 °F in September and 65 °F in October, and snow has all but gone: 0.2 days in April, none from May to October.
Summer is workable but hot. July averages 85 °F for the high and 70 °F for the low, and it is also the wettest month at 117 mm (4.6 inches). The surprise is how little the rain varies. Every month brings between 9 and 12 days of measurable precipitation, and September is the lightest at 8.8 days. There is no dry season to wait for.
Winter is the hard part. In January the average high is 40 °F and the low 28 °F, with 3.7 snow days and 22 cm (about 9 inches) of snow; February adds 3.2 snow days and 26 cm. The building rewards a coat you can take off: there is a free coat check, and the ramp is a quarter mile long. What to wear, month by month, is on our what to bring page.

Bilbao: how wet is it, and which months are driest?

Bilbao: May, June and September win
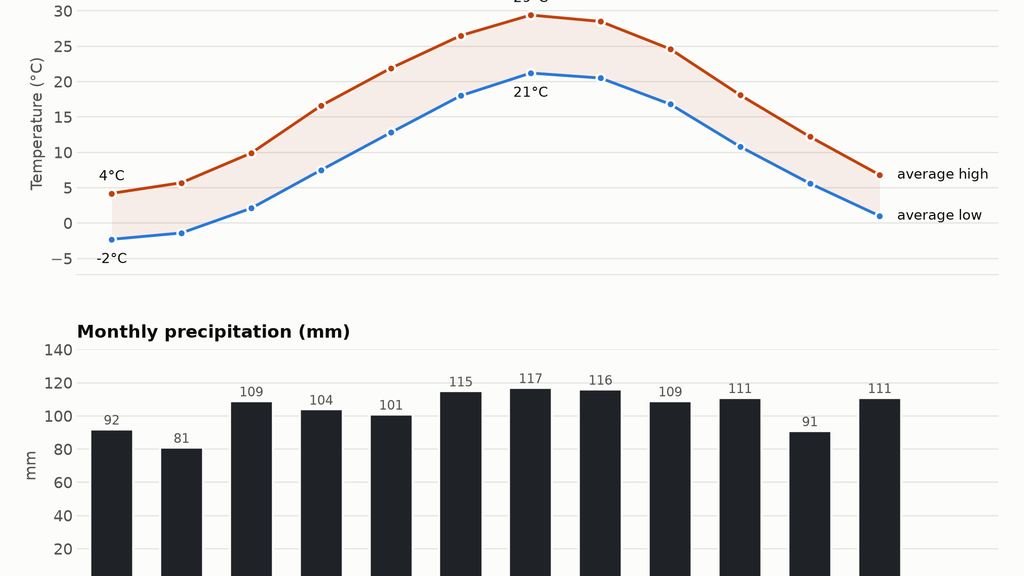
Bilbao gets 1,155 mm of rain a year (about 45 inches) at the airport station, spread over roughly 124 days. The best balance sits in late spring and early autumn: highs of 70 °F in May, 74 °F in June and 76 °F in September, 58 to 76 mm of rain, and 156 to 168 hours of sunshine a month.
July and August are the driest months at 52 and 53 mm and 7.4 wet days, and they are warm without being fierce (78 and 80 °F). They are also the fullest months for hotels, with August the peak, as the section on crowds shows. November is the wettest month, with 171 mm and nearly 14 wet days, and December and January each get only 74 to 75 hours of sun. Our Bilbao tickets and tours page has current hours and prices.
The museum itself offers a hint about the weather. Its visitor tips page recommends dressing in layers in summer because the temperature inside is fairly cool. So a Bilbao July can mean a warm walk along the river and a sweater indoors.
San Sebastián: the wettest city on the list
If you are adding a Basque day trip, plan around the rain. Hondarribia-Malkarroa, a coastal weather station about 15 km east that we use as a proxy for the seafront, records 1,684 mm a year. Igueldo, the station on the hill above the city (251 m), records 1,566 mm. Bilbao gets 1,155 mm. The driest month, July, still has 90 mm of rain on the coast, well above Bilbao's 52 mm.
That is why we put only June and September in the top tier. Highs reach 73 °F in June and 74 °F in September, with 10 wet days in each month. On the coast, expect August highs of 77 °F. Igueldo, the hill station, shows a cooler 73 °F in August. For tours that combine the museum with the Basque coast, see our Basque Country day trips.
Venice: the best time for the Peggy Guggenheim Collection
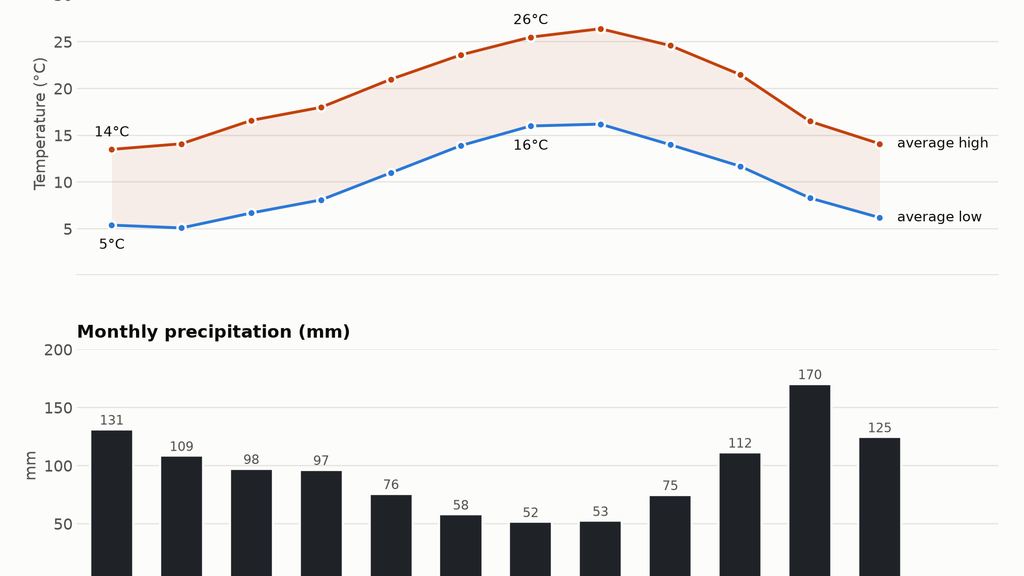
April, May and September are the sweet spot: highs of 63, 72 and 75 °F, 6 to 8 wet days a month, and 174 to 229 hours of sun in spring. Summer is hot and bright. July averages an 83 °F high and 288 hours of sunshine, the most of any month. Winter is cold rather than snowy, with a January low of 32 °F and a high of 46 °F, and only 78 to 81 hours of sun in December and January. Venice is also the driest of the four cities with a rain table here, at about 760 mm a year.
The Venice numbers come with a caveat we should state plainly. We could not retrieve the station table from the Italian environment agency, ISPRA, so these normals are secondary: they come from the climate box on the Venice article of Wikipedia, which cites ISPRA's 1991-2020 values. The World Meteorological Organization package we used for the other cities does not include Venice. Treat Venice figures as good to a degree or two and a few millimeters.
Acqua alta: when does Venice flood, and does the MOSE barrier change the answer?
Acqua alta is the Italian term for high water. The city counts an event from 110 cm above the tidal datum at the Punta della Salute tide gauge. The Comune di Venezia tide office tabulated 296 events at or above that level between 1872 and 2018. We counted them by month from its table.
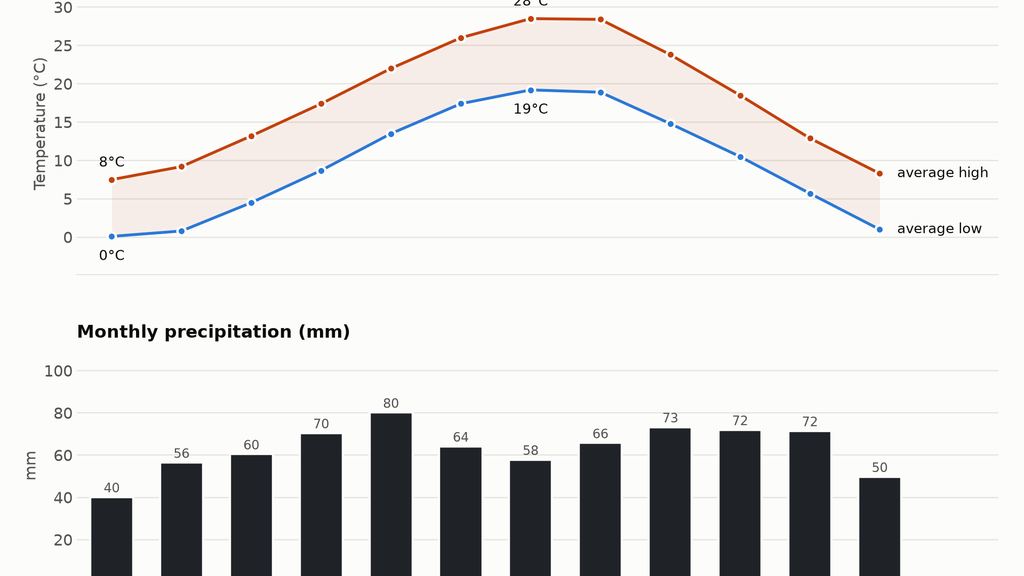
They are strongly seasonal. October to December hold 71% of all events, and November alone 31%; adding January brings it to 80%. The monthly counts from January run 28, 32, 11, 7, 4, 2, 0, 0, 2, 45, 93 and 72. July and August have zero in the whole 1872-2018 table. ISPRA reported that on 28 August 2023 the sea off Venice passed 110 cm at the Punta della Salute gauge for the first time in July or August; MOSE kept the lagoon below 90 cm, so the city stayed dry. "Never in summer" held for the city only because of the barrier.
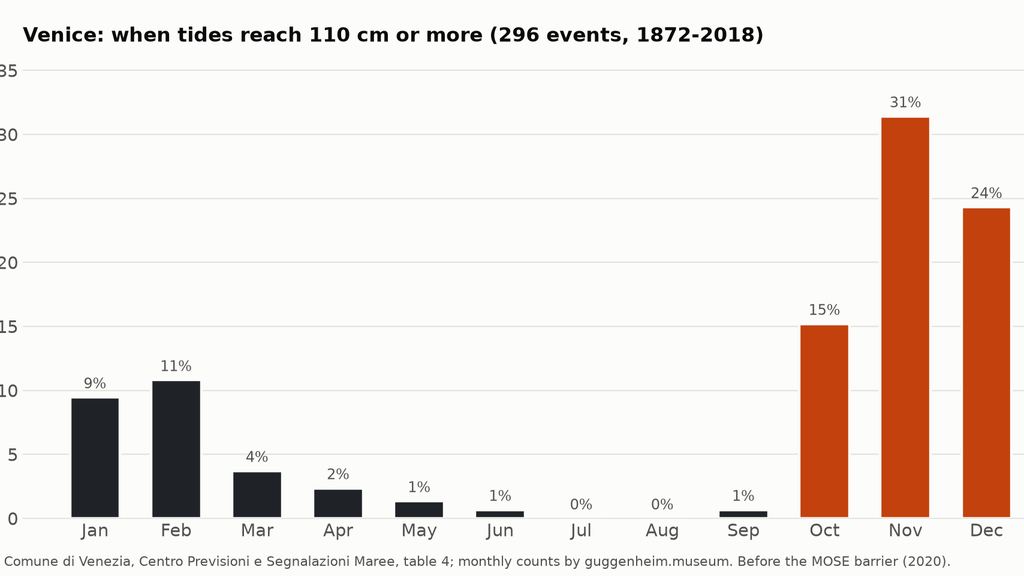
The old pattern matters less than it did. The MOSE system of mobile gates closes the three inlets of the lagoon (Lido, Malamocco and Chioggia) when a high tide is forecast. By the Ministry of Infrastructure's count it was raised 100 times between 2020 and 12 March 2025, and 44 of those lifts were for tides between 80 cm and 1.10 m, so it also acts below the 110 cm line. According to ISPRA's indicator, Venice recorded three events of 110 cm or more from 2020 through 2024: two in 2020 and one on 16 May 2024, which lasted about 15 minutes. In 2019, before the barrier worked, there were 28.
What we did not find is guidance from the museum. The Peggy Guggenheim Collection's visit pages, as we read them on 3 November 2026, do not publish a policy for high water. If a tide is forecast, check the city's tide center (Centro Previsioni e Segnalazioni Maree) and the museum's own channels on the morning. Do not count on either a flood or a dry street from the calendar alone.
Abu Dhabi: why November to March
Guggenheim Abu Dhabi is not open as we write, and the museum had published no hours, rules or opening exhibition on 3 November 2026. The climate is not in doubt. At Abu Dhabi International Airport the 1991-2020 average high is 76 °F in January and 88 °F in November, and from May to September it runs from 103 to 110 °F, with August lows of 86 °F. Rain is nearly absent: about 50 mm a year, almost all of it between November and April. Anything outdoors is easiest in the cool months, which is also when the museum is scheduled to open. Our page on what we know about Abu Dhabi will carry the facts once they exist.
What is the weather in each month? A quick table
| Month | New York (Central Park) | Bilbao (airport) | Venice |
|---|---|---|---|
| January | 40 °F high, 28 °F low; 3.7 snow days | 56 °F; 131 mm; 13 wet days; 75 h of sun | 46 °F high, 32 °F low; 40 mm |
| February | 42 °F; 3.2 snow days; 26 cm snow | 57 °F; 109 mm | 49 °F; 57 mm. Carnival runs between late January and early March |
| March | 50 °F; 2 snow days | 62 °F; 98 mm | 56 °F; 61 mm |
| April | 62 °F; 104 mm | 64 °F; 97 mm; 12 wet days | 63 °F; 71 mm; 7 high-water events on record |
| May | 71 °F; 101 mm | 70 °F; 76 mm; 167 h of sun | 72 °F; 80 mm, the wettest month in the table |
| June | 80 °F; 115 mm | 74 °F; 58 mm; 7 wet days | 79 °F; 64 mm |
| July | 85 °F, the hottest month; 117 mm | 78 °F; 52 mm | 83 °F; 288 h of sun |
| August | 83 °F; 116 mm | 80 °F; 53 mm; fullest hotel month; Aste Nagusia festival | 83 °F; 257 h of sun; no high-water event on record |
| September | 76 °F; 8.8 wet days, the fewest | 76 °F; 75 mm | 75 °F; 73 mm; film festival at the Lido |
| October | 65 °F; 111 mm | 71 °F; 112 mm | 65 °F; 72 mm; high-water season starts |
| November | 54 °F; 91 mm; marathon first Sunday | 62 °F; 171 mm, the wettest month | 55 °F; 72 mm; 31% of high-water events |
| December | 44 °F; 111 mm; 2 snow days | 57 °F; 125 mm; 74 h of sun | 47 °F; 50 mm; 8h43 of daylight at the solstice |
What are the climate normals, and where do they come from?
A "normal" is a 30-year average, and the current standard is 1991-2020. Many Spanish weather pages still display 1981-2010; the public pages of the Spanish agency AEMET did when we checked, and they give slightly different values (for example, a January rainfall of 120 mm in Bilbao against the 131 mm of the newer period). We used the newer figures, taken from the World Meteorological Organization's 1991-2020 package as archived by NOAA, and from NOAA's own U.S. Climate Normals for New York. We list each station so you can check us.
| City | Station | Period | Status |
|---|---|---|---|
| New York | Central Park, NOAA station USW00094728 | 1991-2020 | Primary: NOAA |
| Bilbao | Bilbao Airport, WMO 08025, 42 m | 1991-2020 | Primary: WMO via NOAA |
| San Sebastián | Hondarribia-Malkarroa, WMO 08029, 4 m (coast); Igueldo, WMO 08027, 251 m (hill) | 1991-2020 | Primary: WMO via NOAA |
| Venice | Venice, 2 m, as published in ISPRA's normals | 1991-2020 | Secondary: via Wikipedia |
| Abu Dhabi | Abu Dhabi International Airport, WMO 41217, 27 m | 1991-2020 | Primary: WMO via NOAA |
Two cautions. Airports sit outside the city, so city-center temperatures can run a degree or two different, and a hill station like Igueldo reads cooler in summer than the seafront. And annual rain is a sum of monthly normals, rounded: New York about 1,258 mm (49.5 inches), Bilbao 1,155 mm, San Sebastián coast 1,684 mm, Venice about 762 mm.
When is each city busiest? What the numbers actually show
Honest crowd data is scarce, so we use only what is published. The Spanish statistics institute (INE) publishes monthly hotel overnight stays for Bilbao and San Sebastián. In 2025, hotels in Bilbao recorded 274,573 overnight stays in August against 117,472 in January, a ratio of 2.34 to 1. In San Sebastián August had 245,769 against 115,910 in January, 2.12 to 1. August is the fullest month in both cities, which fits the Aste Nagusia and Semana Grande festivals. July is close behind: 242,893 stays in Bilbao (2.07 times January) and 239,124 in San Sebastián (2.06). In San Sebastián the gap is narrow (August 11.2% of the year against July 10.9% in 2025), and in 2023 July came out ahead. Bilbao's profile is stable: August's share of the year was 12.3% in 2023, 12.0% in 2024 and 11.7% in 2025, and January sat near 5% each year.
Read that number for what it is. It counts overnight stays by every hotel guest in the city, not visitors to the museum, and it says nothing about the queue at the door. It does tell you when beds are scarce.
For the other two cities, no monthly series is public. New York's tourism office reported about 64.3 million visitors for 2024 as a year-end forecast, and we found no public monthly series. Venice publishes annual figures (for 2023, 5.66 million arrivals in the municipality) and nothing by month that we could find. We therefore will not tell you that January is quiet in New York or that October is crowded in Venice. We have no source for either.
Which recurring events change a trip?
We list events by rule rather than by date, because dates move and the rule does not. For this year's dates, check each organizer. We also say what we could and could not confirm about the effect on a museum visit.
| Event | When it recurs | What it means for a visit |
|---|---|---|
| Venice Art Biennale | Even years; opens in spring (9 May in 2026) and runs into November (22 November in 2026). The Architecture edition is in odd years | Long season, so it does not define one month. We have no data on prices or crowds |
| Venice Film Festival | Late August to early September at the Lido; first held in 1932 | Expect September events at the Lido; we have no data on effects |
| Venice Carnival | Moveable: ends on Shrove Tuesday, starts about two and a half weeks before | Runs between late January and early March, depending on Easter |
| Aste Nagusia, Bilbao | The Saturday after 15 August, for nine days | It falls inside the museum's longer summer hours, and August is the fullest hotel month; room occupancy during the 2025 festival was reported at 88.5% (Eustat, secondary) |
| Semana Grande, San Sebastián | The week of 15 August, Saturday to Saturday; fireworks competition since 1964 | August is also the fullest hotel month in San Sebastián, narrowly ahead of July in 2025 |
| Holy Week, Bilbao | Moveable, tied to Easter | The museum has treated it as a peak period by extending its hours, as it does in summer |
| TCS New York City Marathon | First Sunday of November | Street closures: we have not confirmed the effect near the museum |
| Thanksgiving | Fourth Thursday of November | The museum has listed it as a closing day this year; check each year |
| Museum Mile Festival | Second Tuesday of June, evening | Participating museums on Fifth Avenue open free from 6 to 9 p.m. The Guggenheim was among the museums listed for 2026; participation can change, so confirm it each year |
How much daylight will you have?
Daylight shapes a museum day more than people expect, especially for the walk back at the end. Using the standard sunrise and sunset definition, we calculated day length for each city at the June and December solstices. Our margin is about two minutes, and we did not cross-check against the U.S. Naval Observatory tables, which are the place to look for an exact day.
| City | Latitude | 21 June | 21 December |
|---|---|---|---|
| New York | 40.8 N | 15h06 | 9h15 |
| Bilbao | 43.3 N | 15h24 | 8h58 |
| San Sebastián | 43.3 N | 15h24 | 8h58 |
| Venice | 45.4 N | 15h41 | 8h43 |
| Abu Dhabi | 24.5 N | 13h39 | 10h37 |
Venice swings by 7 hours between solstices, and New York by under 6. Average sunshine tells the same story: Bilbao gets 74 hours in December and 177 in July, and Venice 78 against 288. If you are building a winter day in Bilbao or Venice, put the museum in the dark afternoon and the walk in the morning.
Does the museum's schedule change with the season?
Only the structure is worth knowing in advance; the exact days and hours change every year and belong on the pages that own them. Bilbao extends its closing time into the evening in summer and in Holy Week, and has opened on Mondays in summer, while keeping a regular weekly closing day the rest of the year. New York publishes special closing times for individual days and has listed Thanksgiving and Christmas Day as closures. Venice keeps one weekly closing day, Tuesday, plus Christmas Day. We checked these on 3 November 2026. Before you book, go to the city page for current times: New York, Bilbao or Venice. This site is independent and not affiliated with the museums or the Solomon R. Guggenheim Foundation; we link their pages as our sources.
Best time to visit the Guggenheim: common questions
What is the best month to visit the Guggenheim in New York?
April, May, September and October are our four best months. Highs run from 62 to 76 °F in those months and there is almost no snow.
Is it worth visiting the Guggenheim Bilbao in winter?
Yes, if you accept rain. November, December and January each bring 125 to 171 mm and only 74 to 78 hours of sunshine, so plan the museum for the wettest part of the day and leave the walking for dry spells. In 2025 hotel stays in those months ran from 43% (January) to 61% (November) of August's.
When is acqua alta in Venice?
Mostly October to January. Between 1872 and 2018, 71% of events of 110 cm or more fell from October to December and none in July or August. Since 2020 the MOSE barrier has cut the number reaching the historic center to three through 2024.
Does the Peggy Guggenheim Collection close for high water?
We found no published policy on the museum's visit pages on 3 November 2026. Check the museum and the city tide forecast on the day.
Is August a good month for Bilbao or San Sebastián?
It is warm and among the driest months, and it is the fullest month for hotels in both cities. The Aste Nagusia in Bilbao and the Semana Grande in San Sebastián both fall in August.
How rainy is San Sebastián compared with Bilbao?
Considerably more. The coast records about 1,680 mm a year against about 1,155 mm at Bilbao Airport. Pack a rain layer in any month.
When should I visit Guggenheim Abu Dhabi?
The museum is scheduled to open on 11 December 2026, and nothing about hours has been published. Climate points to November through March; from May to September average highs are 103 to 110 °F.
Which climate years did you use?
1991-2020 normals. Many weather pages still show 1981-2010, so their figures differ slightly from ours.
Know when you are going? Pack for it.
Our packing page covers bag limits, clothing by season and the rules of each museum.
Guided tours with Bilbao admission
Tours that include the museum, from third-party operators.

2-Hour Bilbao E-Bike Tour: Old Town Views to Guggenheim and Zubizuri
A 2-hour guided e-bike ride for visitors short on time, from the estuary and La Ribera Market to San Mames, the Euskalduna Bridge and the Guggenheim area.
3-Day Private Basque Country Tour: San Sebastián, Bilbao Guggenheim, Biarritz, Hondarribia
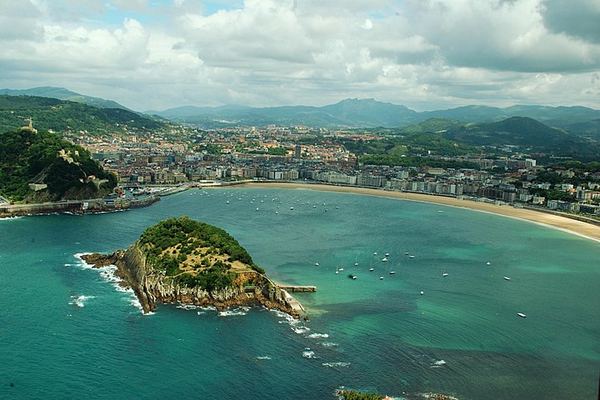
Three days with licensed local guides from Basque Guides: San Sebastián's Old Town, Bilbao and the Guggenheim, then Biarritz, Saint-Jean-de-Luz and Hondarribia.
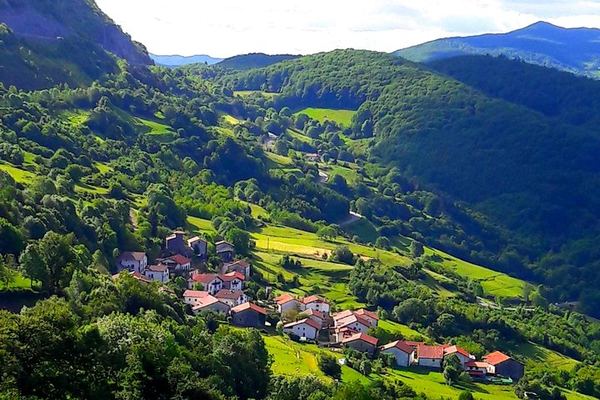
5-Day Private Basque Country Tours: Coast, Biarritz, Bilbao and Rioja Wineries
Five days of private guided tours in the Basque Country, from the Gipuzkoa coast and Biarritz to Bilbao's Guggenheim and two Rioja wineries with lunch.
Ratings collected by Viator and Tripadvisor
Data verified on . Normals 1991-2020: NOAA, WMO, ISPRA (Venice, secondary). Tides: Venice tide office, MIT, ISPRA. Hotel stays: INE. See our editorial policy. Editorial Policy